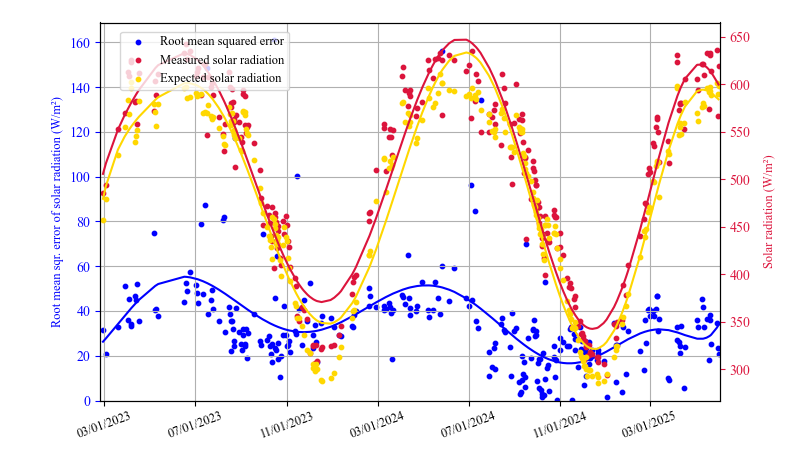
RMSE of Measured SR & Expected SR on Sunny Days For the root mean squared error: calculating the error between measured SR and expected SR
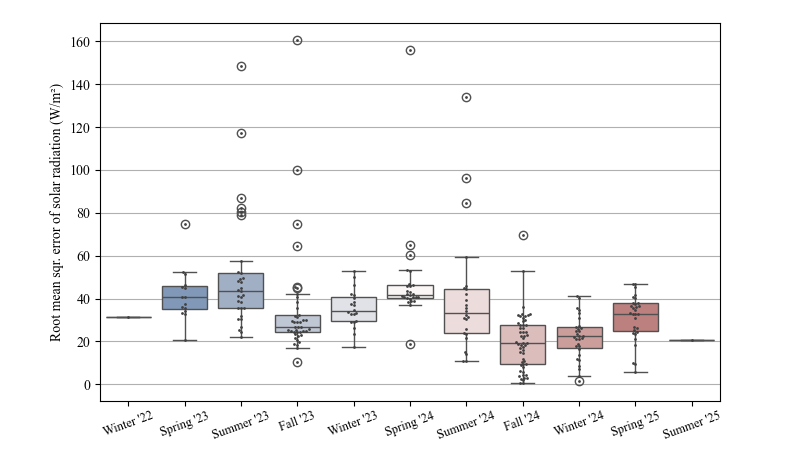
RMSE of Measured SR & Expected SR on Sunny Days Grouped by Season Seasons are defined as: Spring: Mar 1-May 31, Summer: Jun 1-Aug 31, Fall: Sep 1-Nov 30, Winter: Dec 1-Feb 28/29
Measured SR vs Expected SR in Ashland 8S On clear sky days, the daily mean measured SR versus daily mean expected SR
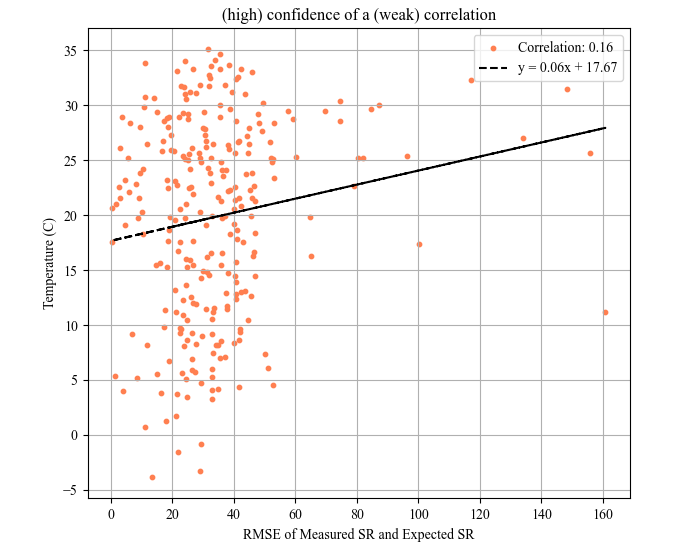
RMSE versus Temperature in Ashland 8S Temperature (average temp during daylight hours) and RMSE (of measured SR and expected SR) on Sunny Days
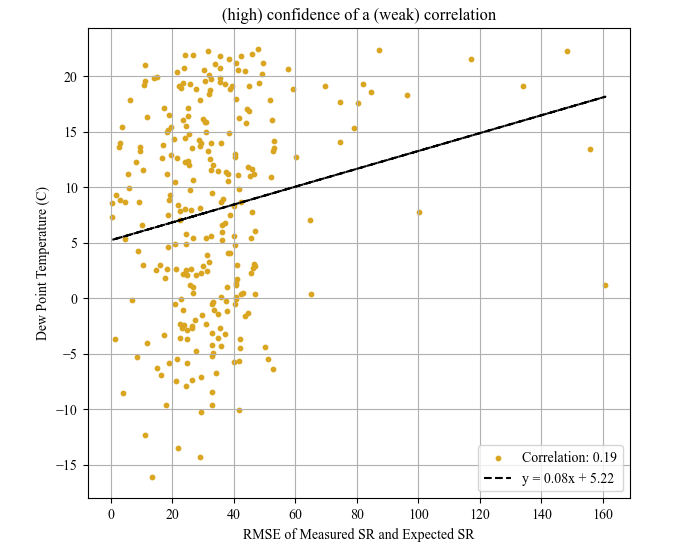
RMSE versus Dew Point in Ashland 8S Dew Point (average dew point during daylight hours) and RMSE (of measured SR and expected SR) on Sunny Days
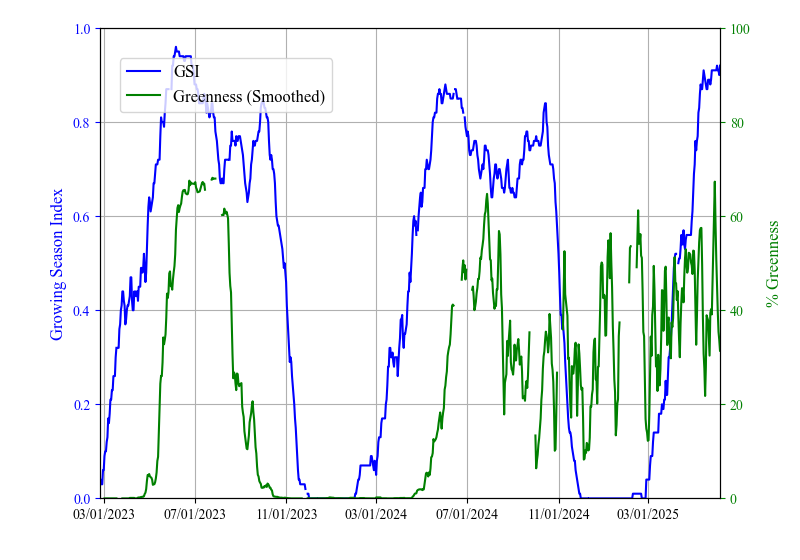
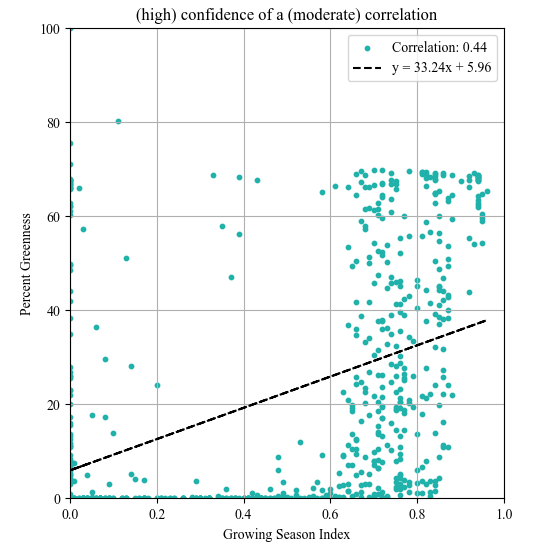
Daily 1PM GSI versus relative % greenness GSI = growing season index; relative % greenness is the % of ground pixels that were green
GSI versus % greenness in Ashland 8S GSI is the growing season index, relative % greenness is the % of ground pixels that are green
Image archival at Ashland 8S began on 02-23-2023. Where is Ashland 8S? Click here to see the map.